Blog Category:
SENTINEL-1
What is Sentinel 1?
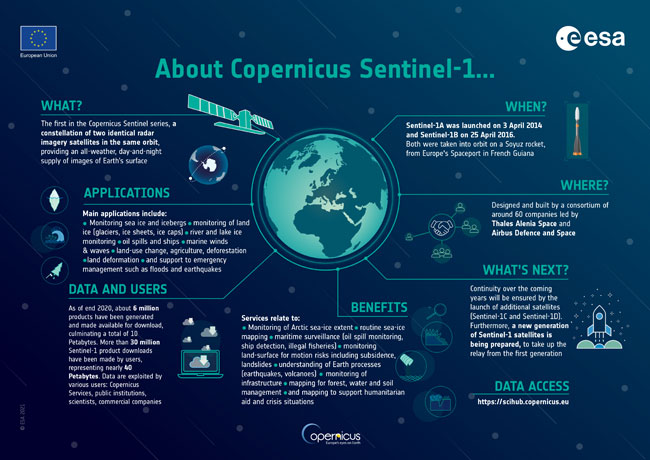
The Sentinel-1 mission is a joint European Commission (EC) and European Space Agency (ESA) program called the European Radar Observatory for Copernicus (ESA). Copernicus is a European initiative to provide environmental and security-related information services. It is based on data from Earth Observation satellites and information from the ground. Sentinel-1 uses C-band imaging in four different imaging modes, each with different resolutions (down to 5 m) and spatial coverage (up to 400 km). It has dual-polarization(VV, VH, HH) capability, quick revisit times, and quick product delivery. Precision measurements of spacecraft location and attitude are provided for each observation. Synthetic Aperture Radar (SAR) benefits from operating at wavelengths that are not hampered by cloud cover or a lack of illumination, unlike …
Read More →
Blog Category:
GOOGLE EARTH ENGINE (GEE)
Minimum, Mean and Maximum NDVI values for Polygon samples on Google Earth Engine (Python API)

Every time I saw the curve as shown above in research papers and blogs, I wondered how it was prepared and what it meant. I used to think the sample curve like this was prepared based upon the point feature. I never thought this could be made based on the polygon samples. Normalized Difference Vegetation Index (NDVI): The Normalized Difference Vegetation Index (NDVI) measures the difference between near-infrared (which vegetation strongly reflects) and red light (which vegetation absorbs) to quantify vegetation. NDVI always ranges from -1 to +1. I am now interested to analyze the time series NDVI statistics (Min, Mean & Max) with polygon samples. NDVI statistics(Min, Max & Mean): Let's take the case; We have multiple crop samples …
Read More →
Histogram from the Image on Google Earth Engine (GEE) with python API
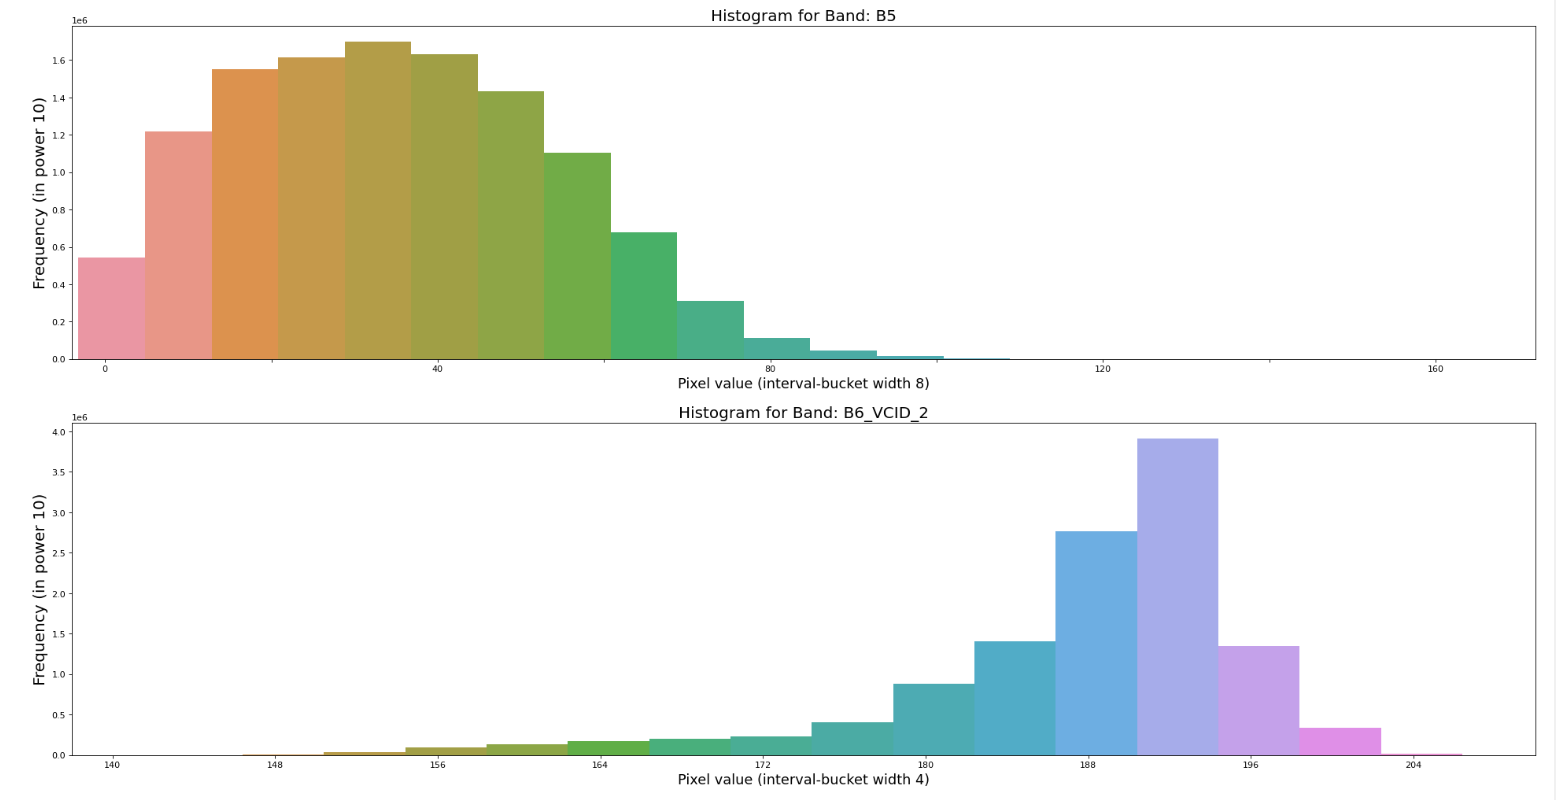
Let’s dive in with the basic concept first. I would like to go with an introduction and use case. Introduction: When presenting and summarizing discrete or continuous data, histogram is the chart you are looking for. By displaying the amount of data points that fall inside a given range of values (referred to as "bins or interval" or "buckets"), it essentially provides a visual interpretation of numerical data. It resembles a horizontal bar graph. A histogram, in contrast to a vertical bar graph, does not display any gaps between the bars. Components of a Histogram: The title: The title describes the information included in the histogram. X-axis: The intervals on the X-axis display the range of values that the measurements …
Read More →
Time series EVI data with Savitzky-Golay filter in Google Earth Engine (GEE) with python API
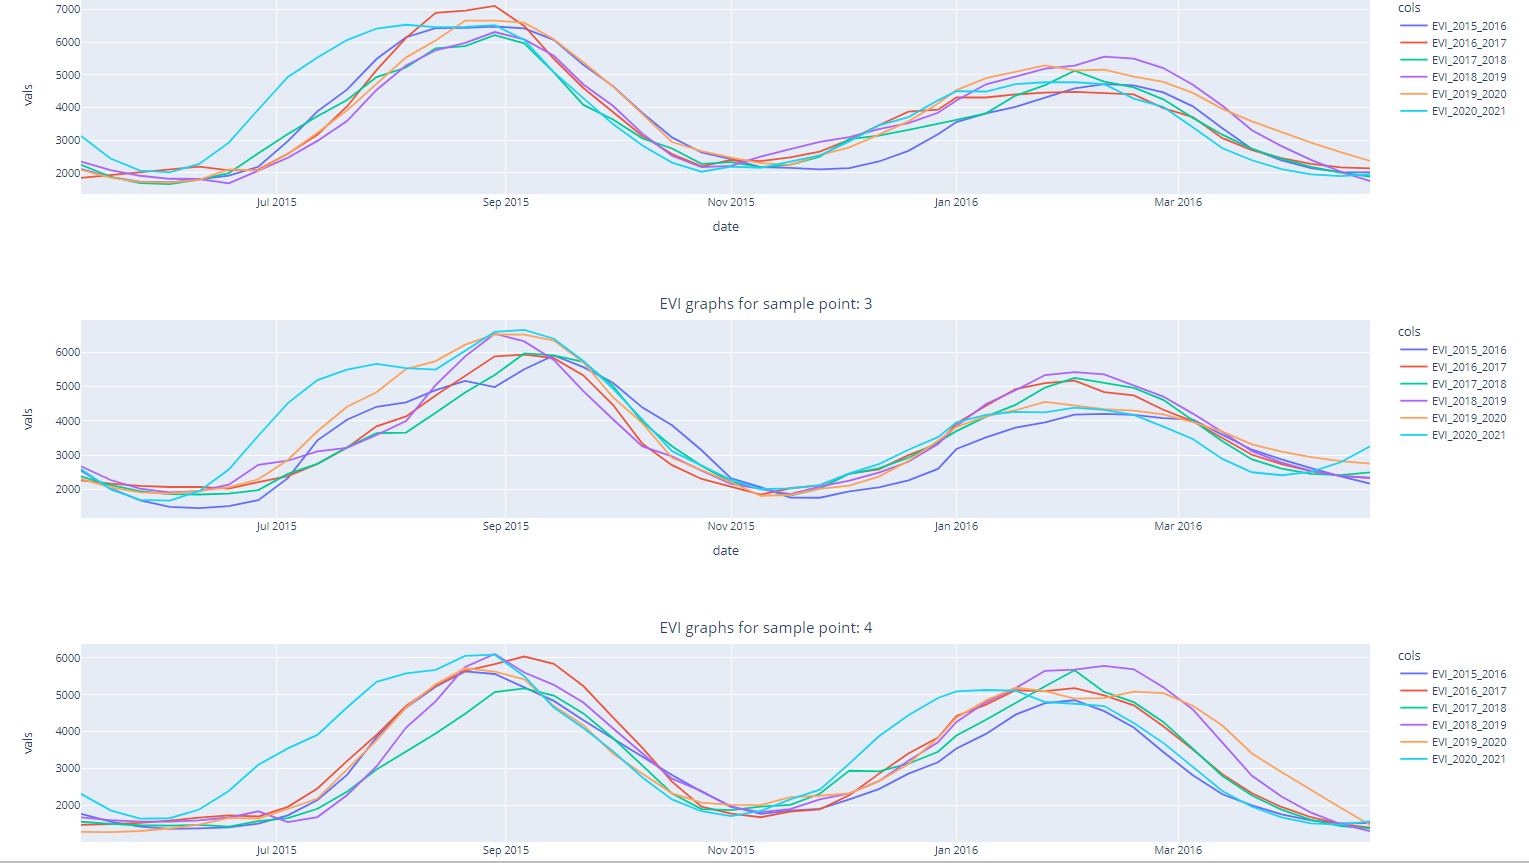
Let's begin with time series data and its analysis: Time series Analysis: A particular method of examining data points gathered over time is called a "time series analysis." Instead of just capturing the data points intermittently or arbitrarily, time series analyzers record the data points at regular intervals over a predetermined length of time. But this kind of study involves more than just gathering data over time. The data analysis can show how variables change over time. Consider a case of predicting weather changes is time series analysis, which aids meteorologists in projecting everything from tomorrow's weather report to upcoming years of climate change. Likewise, we can take the following examples for time series analysis. Weather data Rainfall measurements Temperature …
Read More →
Accessing the Planet's imagery (NICFI's) for analysis from Google Earth Engine (GEE)
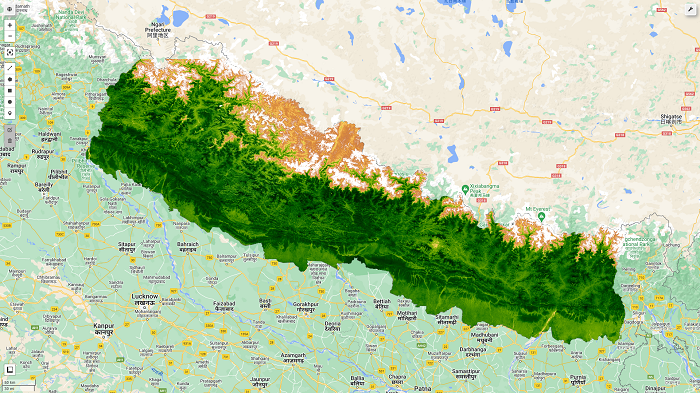
Users can now access Planet's high-resolution, analysis-ready mosaics of the world's tropics through Norway's International Climate & Forests Initiative (NICFI) with an objective to help reduce and reverse the loss of tropical forests, combat climate change, conserve biodiversity, and facilitate sustainable development for non-commercial purposes. This program is launched in partnership with Norway's International Climate and Forest Initiative (NICFI), Kongsberg Satellite Services (KSAT), and Planet. Please, go to this link: https://www.planet.com/nicfi/#sign-up for signing up. You have to fillup the form, and it will guide you on how to proceed with accessing data. For details and accessing the data, please do visit: https://www.planet.com/nicfi/ Planet Developer's note on NICFI Before we move on, we need details of resolution and band information of the planet image. Here's the …
Read More →
Extraction of raster values from point samples on Google Earth Engine (GEE)
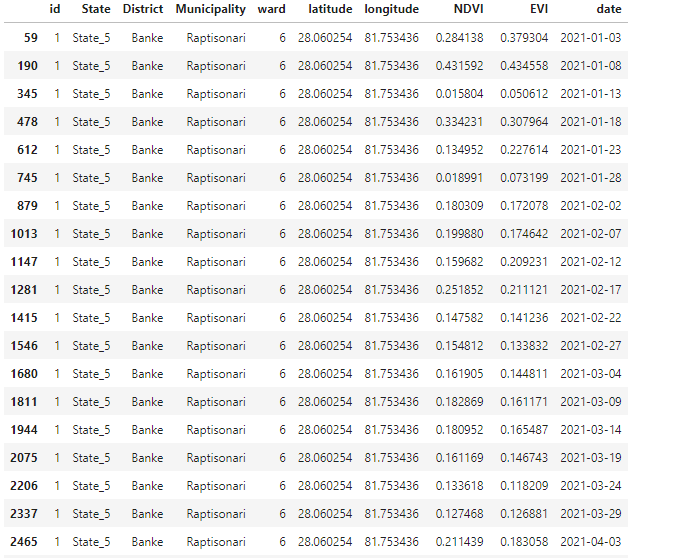
Background: In this tutorial, We plan to extract the raster cell values from the set of point features nd records the values in the attribute table as an output. on Google Earth Engine (GEE) with python API. Before we dive into the working steps, I will explain the general idea of how this concept can be implemented. The process of raster value extraction can be implemented in two ways, Directly extracting the raster values by overlaying raster with point data. Raster value which perfectly overlays with the point is taken. Buffer (circle, square) around the point is created, and raster statistics (mean) are obtained. This mean is taken as the raster value for points. Refer this: Scenario, where you are going …
Read More →
Downloading images from Google Earth Engine to local drive ( A case study for Timesat image Preparation for Planting Date)
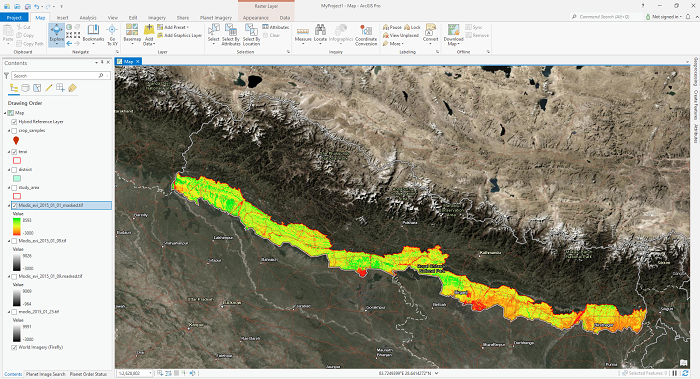
Satellite image processing might be very painful, depending upon the volume of data. I don't like to be suggesting the data download and do image analysis on your local device. But there might be a time when we can't follow this suggestion. I passed through a similar situation for analyzing MODIS EVI datasets to determine the planting date for Rice. I was advised to use Timesat (Welcome to the TIMESAT pages! (lu.se)) for this task. Instead, I had no options to download MODIS EVI data (250 m resolution, 8 Day temporal resolution-terra and Aqua sensors combined). I used Google Earth Engine (GEE) to download the data into my local device and prepare the dataset in the desired format for Timesat …
Read More →
Retrieving Leaf Area Index (LAI) on Sentinel 2 image with Google Earth Engine (GEE)
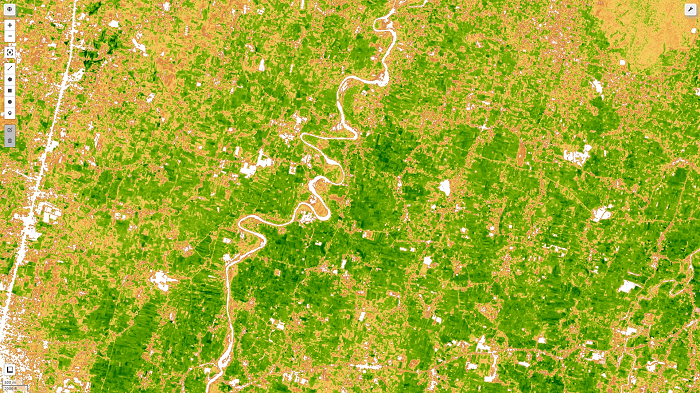
What is Leaf area index (LAI)? The leaf area index (LAI), equal to half of the total green leaf area per unit of the horizontal ground surface, is a crucial structural feature of vegetation. Canopy interception, evapotranspiration, and gross photosynthesis are directly related to LAI since leaf surfaces constitute the primary frontier of energy and mass exchange. I have explained this on my previous post, but I thought it needs to be covered in sperate post along with step by step guide for computation of LAI. I have uploaded the notebook for it's implementation at the end of this article. Leaf Area Index (LAI) Formula: This index is used to forecast crop growth and yield and estimate foliage cover. ENVI calculates …
Read More →
Calculating different Vegetation Indices in Google Earth Engine (Sentinel -2 images)
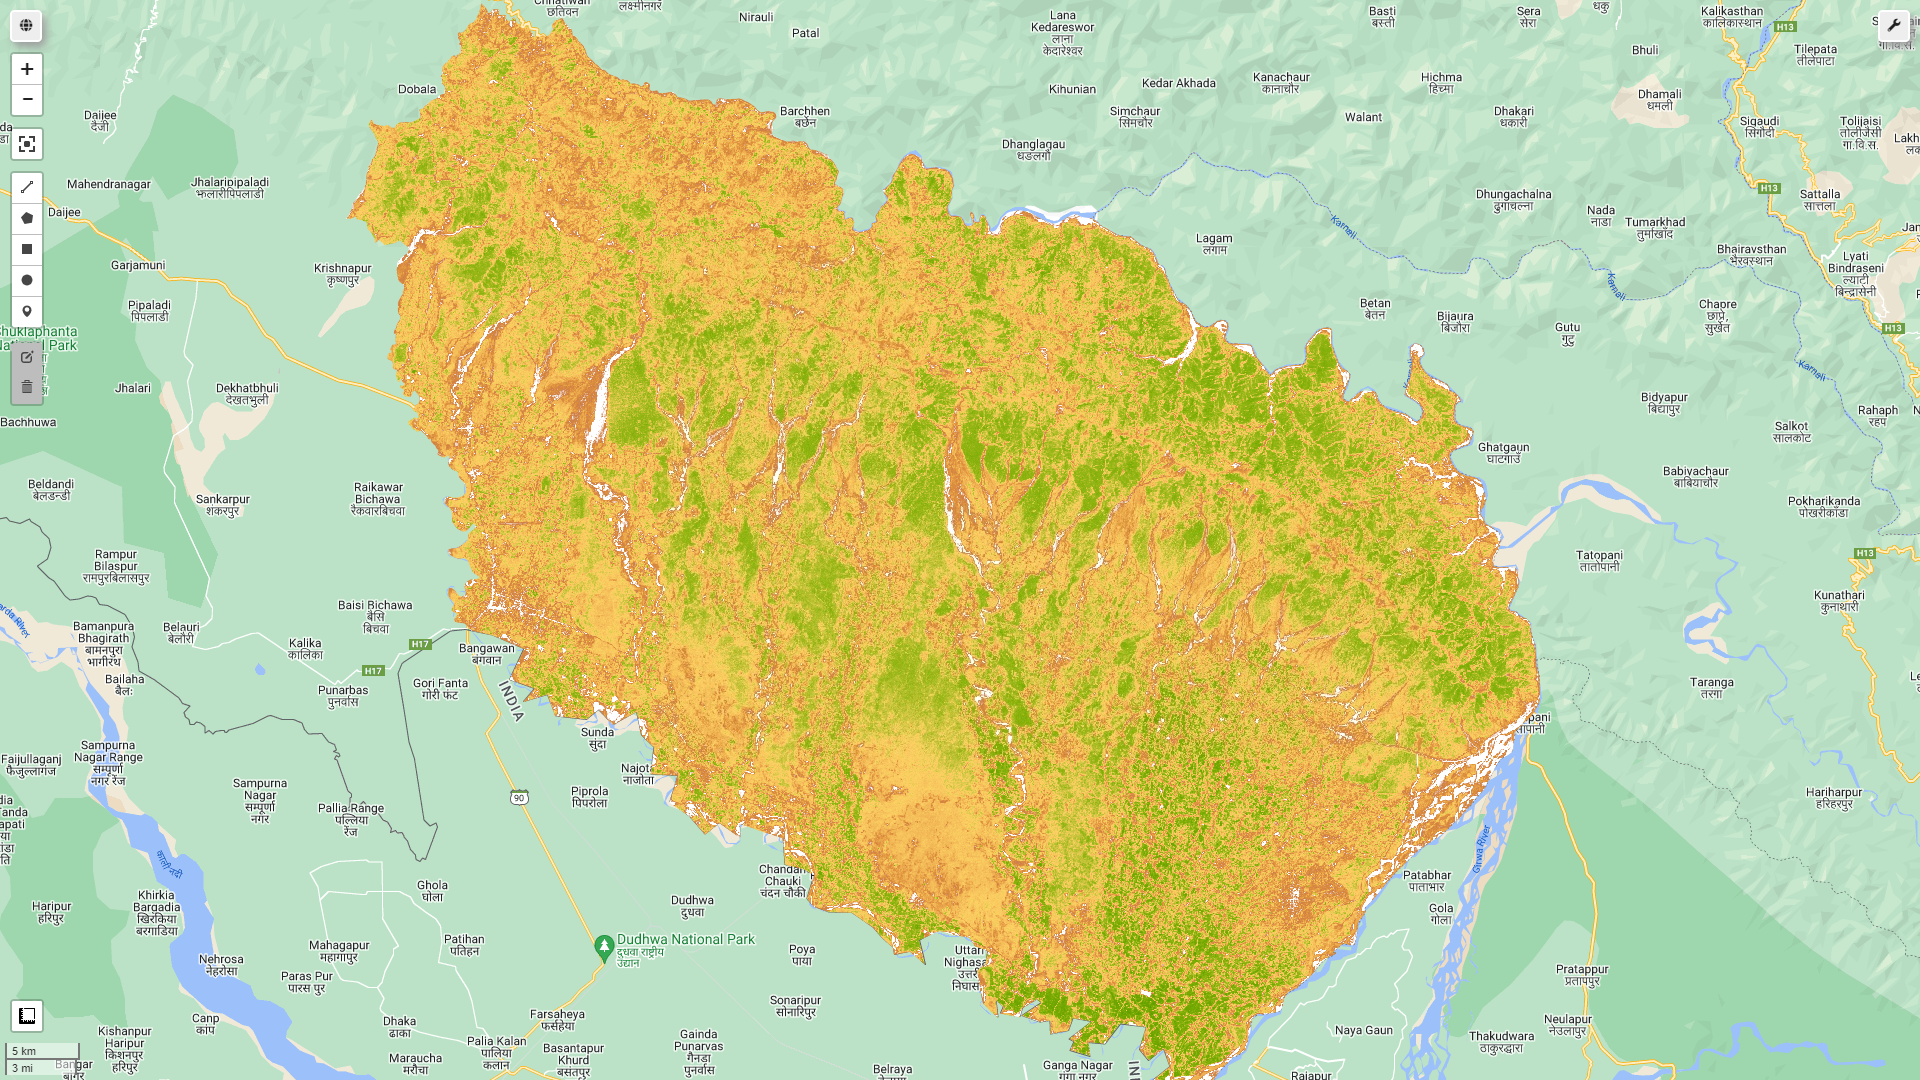
In previous post, I have published the article for EVI and NDVI calculation from sentinel 2 image on Google earth engine (GEE) platform. In this article, I will be showing how various vegetation indices can be computed on GEE platforms and can be added to image collection. So, let's dive into various vegatation indices directly. Greenness (Green Leaf Index) The Green Leaf Index, also known as the Greenness Index, shows how the reflectance in the green channel compares to the other two visible wavelengths (red and blue). The formula for calculation of GLI is: GLI = (2*GRN-RED-BLU)/(RED+GRN+BLU) GRN pixel values from the GREEN band RED pixel values from the RED band BLU pixel values from the BLUE band The lower the greenness index, the higher …
Read More →
Calculating NDVI from Sentinel-2 Images
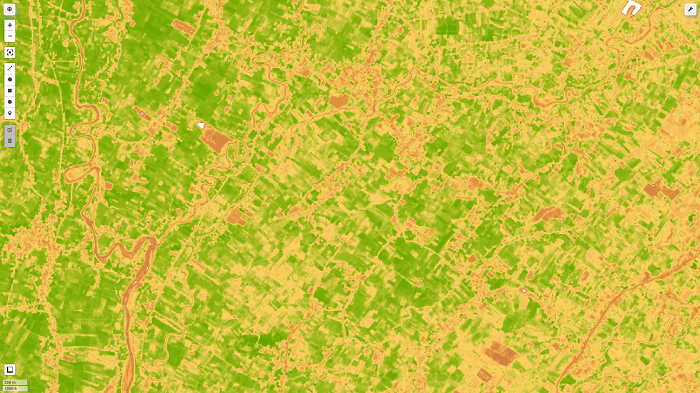
Let's start with the introduction: What is NDVI (Normalized Difference Vegetation Index)? The Normalized Difference Vegetation Index (NDVI) measures the difference between near-infrared (which vegetation strongly reflects) and red light (which vegetation absorbs) to quantify vegetation. NDVI always ranges from -1 to +1. If there are no green leaves, the value is zero. A zero denotes no vegetation, whereas a value close to +1 (0.8-0.9) suggests the highest density of green leaves conceivable. However, the land cover type does not have its specific limit of NDVI values. Normalized Difference Vegetation Index (NDVI) Formula: The formula for calculating NDVI is as follows: NDVI = (NIR — RED)/(NIR + RED) NIR – reflection in the near-infrared spectrum RED – reflection in the …
Read More →
Enhanced Vegetation Index (EVI) from Sentinel-2 image on Google Earth Engine
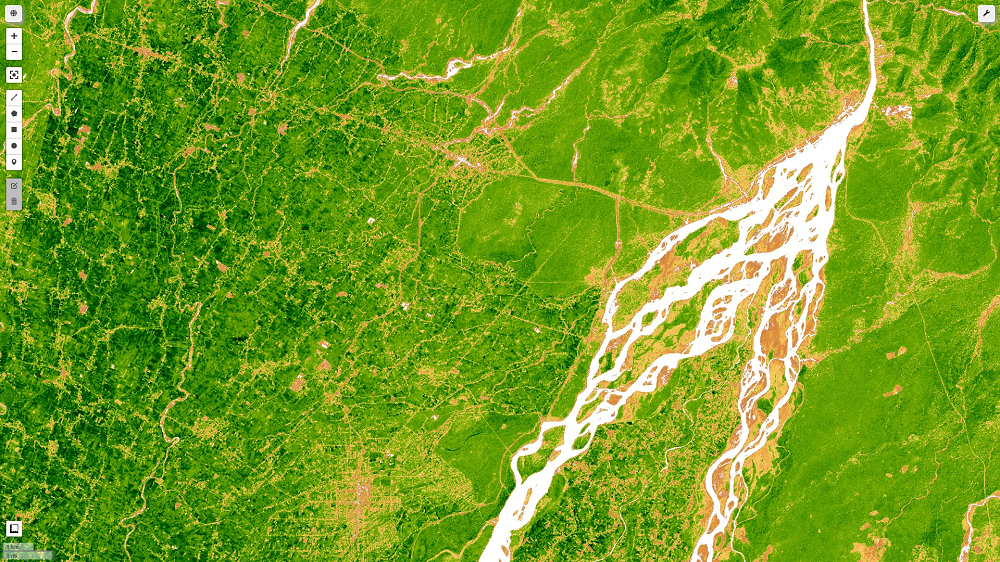
What is Enhanced Vegetation Index (EVI)? The enhanced vegetation index (EVI) is an 'optimal' vegetation index that decouples the canopy background signal and reduces atmospheric impacts to improve the vegetation signal with greater sensitivity in high biomass regions and improved vegetation monitoring. The Enhanced Vegetation Index (EVI) from Landsat, Sentinel-2 image is comparable to the Normalized Difference Vegetation Index (NDVI), and it quantifies the vegetation greenness. While the EVI is calculated in the same way as the NDVI, it accounts for some distortion in reflected light caused by airborne particles and the ground cover beneath the vegetation. When examining rainforests and other areas of the Earth with high levels of chlorophyll, the EVI data product does not get saturated as …
Read More →
Vector tiles with Django for developing GIS web applications
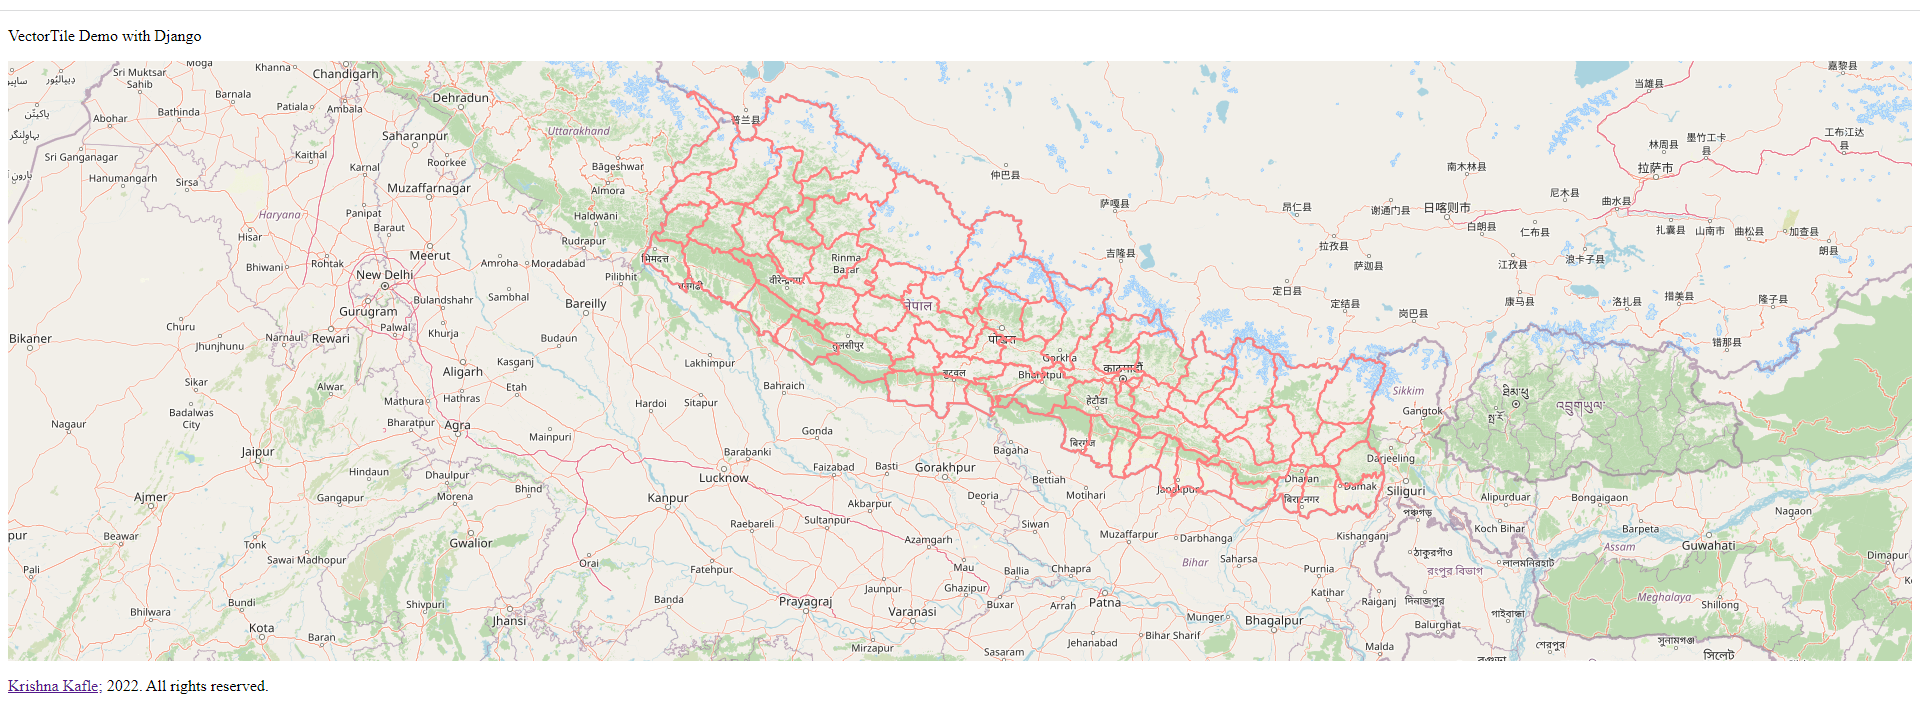
You are reading this article, so I assume you have faced problems loading vector layers in the web map. I will discuss visualizing the large shapefiles/geojson on web maps. So let's first dive into the concept of web mapping. Anyone working on webGIS will find this post beneficial. OGC Standards (Ref) OGC standards are developed by members to make location information and services FAIR – Findable, Accessible, Interoperable and Reusable. They are used by software developers to build open interfaces and encodings into their products and services. Standards are the main "products" of OGC and have been developed by the membership to address specific interoperability challenges, such as publishing map content on the Web, exchanging critical location data during …
Read More →
Deploying Django Application on Ubuntu 20.04 Server with NGINX
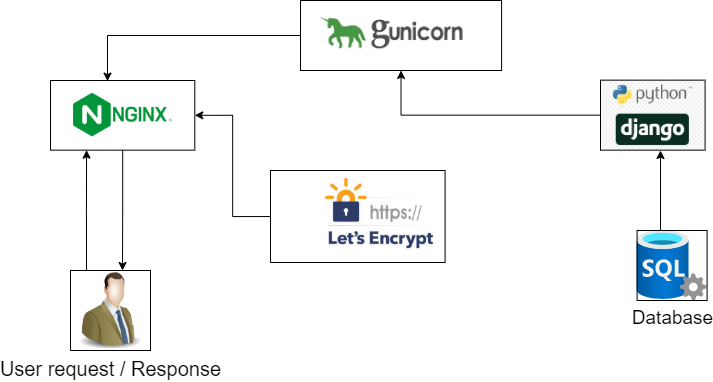
This blog post is intended for the demonstration of deploying django application in ubuntu 20.04 This guide is a walk-through on how to setup Ubuntu Server for hosting Django websites. The Django stack that will be used in this guide is Ubuntu, Nginx, and Gunicorn. This stack was chosen solely because from the reading I've done these seems to be one of the latest "standard" stacks for Django deployment. This guide also assumes that you're familiar with Ubuntu server administration and Django. Also of note, the sample code used for deploying demonstrated in the blog can be found here: Github link Hosting django application might be painful for beginner but not anymore. I will go through each step for …
Read More →
Blog Category:
MACHINE LEARNING
What Is Unsupervised Learning? How Does It Work?
Unsupervised learning is a subfield of machine learning which deals with algorithms that learn from data that has not been explicitly labeled. This type of learning is typically employed when the number of training instances is too large or costly to manually label. Unsupervised methods can be used for classification, regression, and clustering tasks. The advantage of unsupervised learning is that it can identify hidden patterns in data which may not be discernible through manual inspection. Unsupervised learning is a subfield of machine learning which deals with algorithms that learn from data that has not been explicitly labeled. This type of learning is typically employed when the number of training instances is too large or costly to manually label. Unsupervised …
Read More →
Data Pre-processing Process for ML Models
Data preprocessing, on simple way can be said as a transformation technique that transform the raw from of data to suitable format for building & training machine learning models. It is the most cruicial steps for enhancing the quality of data so that the extraction of meaningful information/Insights is possible. During this step, we will make sure the data is in required format for the ML Model and this formated data is free from noise, complete and consistent. Now I will list out why we cant use raw data for ML model: Raw data are highly vulnerable to missing, noise, outliers and inconsistent because of their huge size, multiple resources and their gathering methods. Poor quality data will negatively effect on ML model …
Read More →
Components of Machine learning
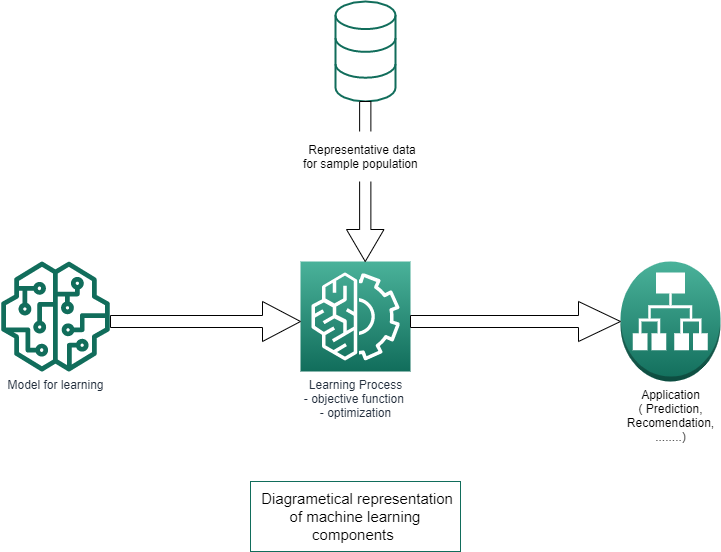
We learnt the defination of machine learning and it's conceptual overview in previous post. We wil now move on to the components of machine learning. Components for machine learning are represented in different forms from different source. I will be disscusing the basic components that constitute the Machine learning approach. Data: I don't have to say much about data, right? We expirence it in each moment of life. The blog you are reading, Tea/coffee in your hand, thoughts inside your brain, even counter arguments you are having against this post all represents common information of our daily life. These are the one form of data, may be these examples are not intresting for you. let's pick up the unusaul one, your …
Read More →
Introduction of machine learning

I will begin the machine learning series with this blog. First we will walk through basic concepts for building the foundation and we will walk with implementation code. We can found lots of content defining the machine learning which are complicated to grasp for the beginners. I will try to elaborate in more understandable and simplified form. Defination: let's start with the simple concept of human learning process. let's observe the following picture and say what it is. You can say apple, right? Sounds silly question and it may be. But do you know how you are able to recognise this as apple? It 's simply because you have been taught to pronuce this as an apple. In other …
Read More →


