
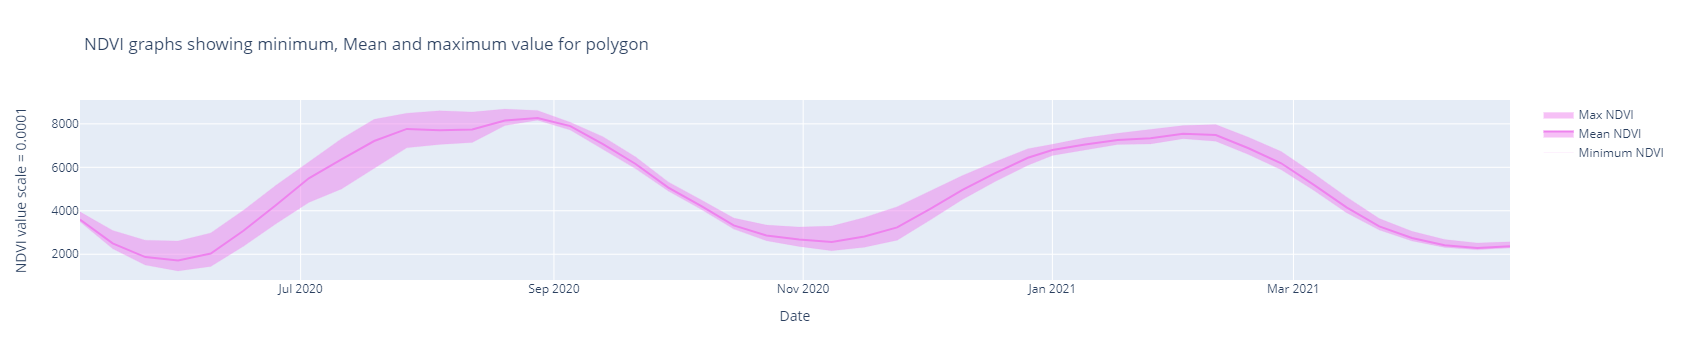
Minimum, Mean and Maximum NDVI values for Polygon samples on Google Earth Engine (Python API)
")
Every time I saw the curve as shown above in research papers and blogs, I wondered how it was prepared and what it meant. I used to think the sample curve like this was prepared based upon the point feature. I never thought this could be made based on the polygon samples.
Normalized Difference Vegetation Index (NDVI):
The Normalized Difference Vegetation Index (NDVI) measures the difference between near-infrared (which vegetation strongly reflects) and red light (which vegetation absorbs) to quantify vegetation. NDVI always ranges from -1 to +1. I am now interested to analyze the time series NDVI statistics (Min, Mean & Max) with polygon samples.
NDVI statistics(Min, Max & Mean):
Let's take the case; We have multiple crop samples as a polygon. We must inspect the sample with time series NDVI, EVI, or Band values. We also need Minimum, Mean and maximum values to present us with the insight and information polygon sample. This information benefits us as we can decide whether the polygon sample is giving a representative area or not. And we can adjust our sample accordingly.
The expected outcome for this blog post is as follows:
I will be sharing the link only for github code for this:
Source code: github_link
Please let us know your thoughts on this with following comment section we will definetly reach out to you on your query and feedback.
0 Comments