
Retrieving Leaf Area Index (LAI) on Sentinel 2 image with Google Earth Engine (GEE)
 on Sentinel 2 image with Google Earth Engine (GEE)")
What is Leaf area index (LAI)?
The leaf area index (LAI), equal to half of the total green leaf area per unit of the horizontal ground surface, is a crucial structural feature of vegetation. Canopy interception, evapotranspiration, and gross photosynthesis are directly related to LAI since leaf surfaces constitute the primary frontier of energy and mass exchange.
I have explained this on my previous post, but I thought it needs to be covered in sperate post along with step by step guide for computation of LAI. I have uploaded the notebook for it's implementation at the end of this article.
Leaf Area Index (LAI) Formula:
This index is used to forecast crop growth and yield and estimate foliage cover. ENVI calculates green LAI using the empirical formula developed by Boegh et al. (2002):
LAI = (3.618*EVI - 0.118)

EVI is Enhanced Vegetation Index value
Details for calculation of EVI is here in my previous post.
LAI values ranges typically from 0 to 3.5.
Leaf area index (LAI) value range: 0 to 3.5
The LAI values can approach 3.5 when the scene comprises clouds and other bright objects that cause saturated pixels. Before making an LAI image, you should mask clouds and bright features from your scene.
Calculation of LAI for Sentinel 2 in Google Earth Engine (GEE):
Now, we go one by one step for computation of LAI on Google Earth Engine with python API:
-
Import earth engine api, geemap and authenticate GEE
# Import earth engine python api and geemap import geemap, ee # Authenticate the earthengine with credentials ee.Initialize() - Provide area of interest for calculation
# get our Nepal boundary # I have taken level 0 data for country data from FAO datasets aoi = ee.FeatureCollection("FAO/GAUL/2015/level0") \ .filter(ee.Filter.eq('ADM0_NAME','Nepal')).geometry() # adjust indentation here, May get error - Define function for EVI calculations
def getEVI(image): # Compute the EVI using an expression. EVI = image.expression( '2.5 * ((NIR - RED) / (NIR + 6 * RED - 7.5 * BLUE + 1))', { 'NIR': image.select('B8').divide(10000), 'RED': image.select('B4').divide(10000), 'BLUE': image.select('B2').divide(10000) }).rename("EVI") image = image.addBands(EVI) return(image) - Date of image, addtion in image collection as a properties
def addDate(image): img_date = ee.Date(image.date()) img_date = ee.Number.parse(img_date.format('YYYYMMdd')) return image.addBands(ee.Image(img_date).rename('date').toInt()) - Filter image and apply EVI computation formula
# filter sentinel 2 images and apply the EVI formula, finally we obtain # single image with median operation Sentinel_data = ee.ImageCollection('COPERNICUS/S2') \ .filterDate("2022-03-01","2022-03-31").filterBounds(aoi) \ .map(getEVI) - Computation of EVI
def getLAI(image):
    LAI = image.expression(
        '(3.618*EVI - 0.118)', {
            'EVI': image.select('EVI')
        }).rename("LAI")
    image = image.addBands(LAI)

    return(image)
We will be using formula: LAI = (3.618*EVI - 0.118) for LAI
-
Apply LAI computation function to the image
Lai_image = Sentinel_data.map(getLAI).map(addDate).median().clip(aoi) - Add layers to map and visualize it.
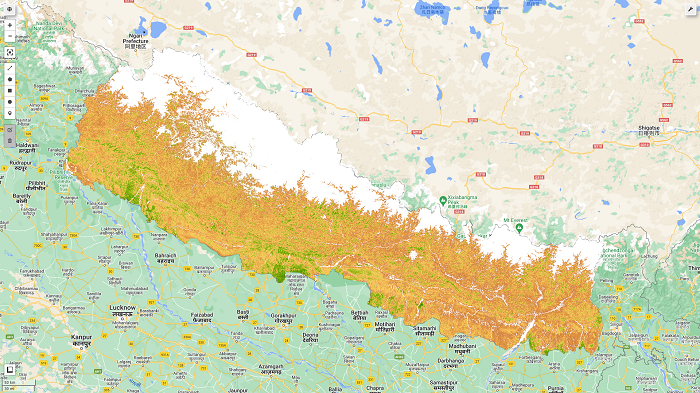
# set some thresholds
#  A nice EVI palette
palett = [
    'FFFFFF', 'CE7E45', 'DF923D', 'F1B555', 'FCD163', '99B718',
    '74A901', '66A000', '529400', '3E8601', '207401', '056201',
    '004C00', '023B01', '012E01', '011D01', '011301']

pall = {"min":0.5, "max":3.5, 'palette':palett}
map1 = geemap.Map()
map1.centerObject(aoi, 8)
map1.addLayer(Lai_image.select('LAI'), pall, "LAI")

map1.addLayerControl()
map1
The expected output for this tutorial as shown in the figure below:
Source code: github_link
Please let us know your thoughts on this with following comment section we will definetly reach out to you on your query and feedback.
Jorge Conrado Conforte | View the Lai figure
Feb. 9, 2023, 1:28 p.m.
Hi, I'm new geemap, I run your script LAI_calculations.py. Please, how can I visualize and save the Lai figure. Thanks, Conrado