
Time series EVI data with Savitzky-Golay filter in Google Earth Engine (GEE) with python API
 with python API")
Let's begin with time series data and its analysis:
Time series Analysis:
A particular method of examining data points gathered over time is called a "time series analysis." Instead of just capturing the data points intermittently or arbitrarily, time series analyzers record the data points at regular intervals over a predetermined length of time. But this kind of study involves more than just gathering data over time. The data analysis can show how variables change over time.
Consider a case of predicting weather changes is time series analysis, which aids meteorologists in projecting everything from tomorrow's weather report to upcoming years of climate change. Likewise, we can take the following examples for time series analysis.
- Weather data
- Rainfall measurements
- Temperature readings
- Stock prices
- Automated stock trading
- Sales forecasts
- Vegetation indices like NDVI, EVI
Satellite Image Time Series (SITS):
A collection of satellite images obtained from the exact location at various time intervals can be defined as a satellite image time series (SITS). A SITS utilizes various satellite sources to produce a more extensive data set.
With time series satellite images, it is possible to comprehend how the earth's surface changes, identify the factors causing these changes, and forecast future changes using satellite measurements. The combination of information from spatial models and remotely sensed data presents a chance to predict and comprehend the behavior of the earth's surface.
Our use case scenario:
Now, I will demontrate the EVI time series data for 10 samples points from Nepal. These points are random crop sample, We are going to observe the time Series EVI phenology and apply the Savitzky-Golay filter in Google Earth Engine (GEE) with python api. I will demonstrate the Savitzky-Golay filter for extracted point pixel values on this post. We will be dealing with raster for applying Savitzky-Golay filter in upcoming posts.
Now, Let's dive into the code:
-
Import Google earth engine API and Authenticate
# import Google earth engine module import ee #Authenticate the Google earth engine with google account # First firt setup only, no need to run this after first run # ee.Authenticate() # for normal/regular use for authorization # this is required regularly ee.Initialize() - Import other package pandas, plotly, and Savitzky-Golay filter
#Pandas modules to interact data import numpy as np import pandas as pd import geopandas as gpd # Using plotly.express import plotly.express as px from scipy.signal import savgol_filter import warnings warnings.filterwarnings('ignore') - Define starting and ending year of study (Both year Inclusive)
# Longer the duration, Longer it will take for Processing and downloading of Images StartDate = '2015-05-01' EndDate = '2021-04-30' - Convert the pandas dataframe into Google Earth Engine (GEE) Feature Collection
I have point sample points as a shapefile, Now i would convert this point shapefile to the feature collection of Google Earth Engine (GEE). For this I have used geopandas to load shapefile as dataframe and convert this dataframe to gee feature collection.gdf =gpd.read_file('shapefile/sample_points.shp') features=[] for index, row in gdf.iterrows(): # print(row.geometry.x, dict(row)) # construct the geometry from dataframe poi_geometry = ee.Geometry.Point([row.geometry.x, row.geometry.y]) # print(poi_geometry) # construct the attributes (properties) for each point poi_properties = {'id':row['point_id']} # construct feature combining geometry and properties poi_feature = ee.Feature(poi_geometry, poi_properties) # print(poi_feature) features.append(poi_feature) # final Feature collection assembly ee_fc = ee.FeatureCollection(features) ee_fc.getInfo() - Import and combin data from 2 sensors of MODIS (Terra And Aqua)
I am merging 2 image collectons into 1 image collection on google earth engine with merge function.# add satellite time series: MODIS EVI 250m 16 day ------------- # terra sensor collectionModEvi_terra = ee.ImageCollection('MODIS/006/MOD13Q1').filterDate(StartDate,EndDate) \ .filterBounds(ee_fc)\ .select('EVI') # Aqua sensor collectionModEvi_aqua = ee.ImageCollection('MODIS/061/MYD13Q1').filterDate(StartDate,EndDate) \ .filterBounds(ee_fc)\ .select('EVI'); collectionModEvi = collectionModEvi_terra.merge(collectionModEvi_aqua) # THis will provide us 250 m of EVI datasets from MODIS on 8 day interval - Extract the raster values for each point features
def rasterExtraction(image): feature = image.sampleRegions( collection = ee_fc, # feature collection here scale = 10 # Cell size of raster ) return feature # manage the date formating as per your requirements # Mine is in format of YYYYMMdd def addDate(image): img_date = ee.Date(image.date()) img_date = ee.Number.parse(img_date.format('YYYYMMdd')) return image.addBands(ee.Image(img_date).rename('date').toInt()) - Apply the raster value extraction function and get it as the pandas dataframe
ModEVI = collectionModEvi.filterBounds(ee_fc).map(addDate).map(rasterExtraction).flatten() sample_result = ModEVI.first().getInfo() # extract the properties column from feature collection # column order may not be as our sample data order column_df = list(sample_result['properties'].keys()) nested_list = ModEVI.reduceColumns(ee.Reducer.toList(len(column_df)), column_df).values().get(0) data = nested_list.getInfo() # dont forget we need to call the callback method "getInfo" to retrieve the data df = pd.DataFrame(data, columns=column_df) # we obtain the data frame as per our demand # df df['date']= pd.to_datetime(df['date'], format='%Y%m%d') - Sample data chart for single points for all years
df_new = df[df['id']==1].sort_values(by=['date'])

# ds = px.data.stocks()
fig = px.line(df_new, x='date', y="EVI")
fig.show()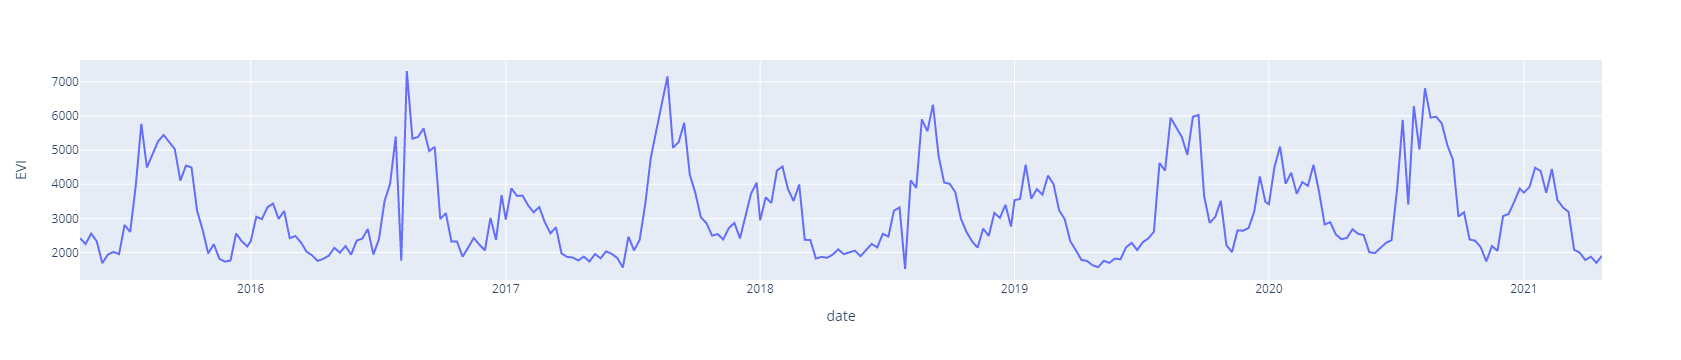
-
Generalization for all sample points
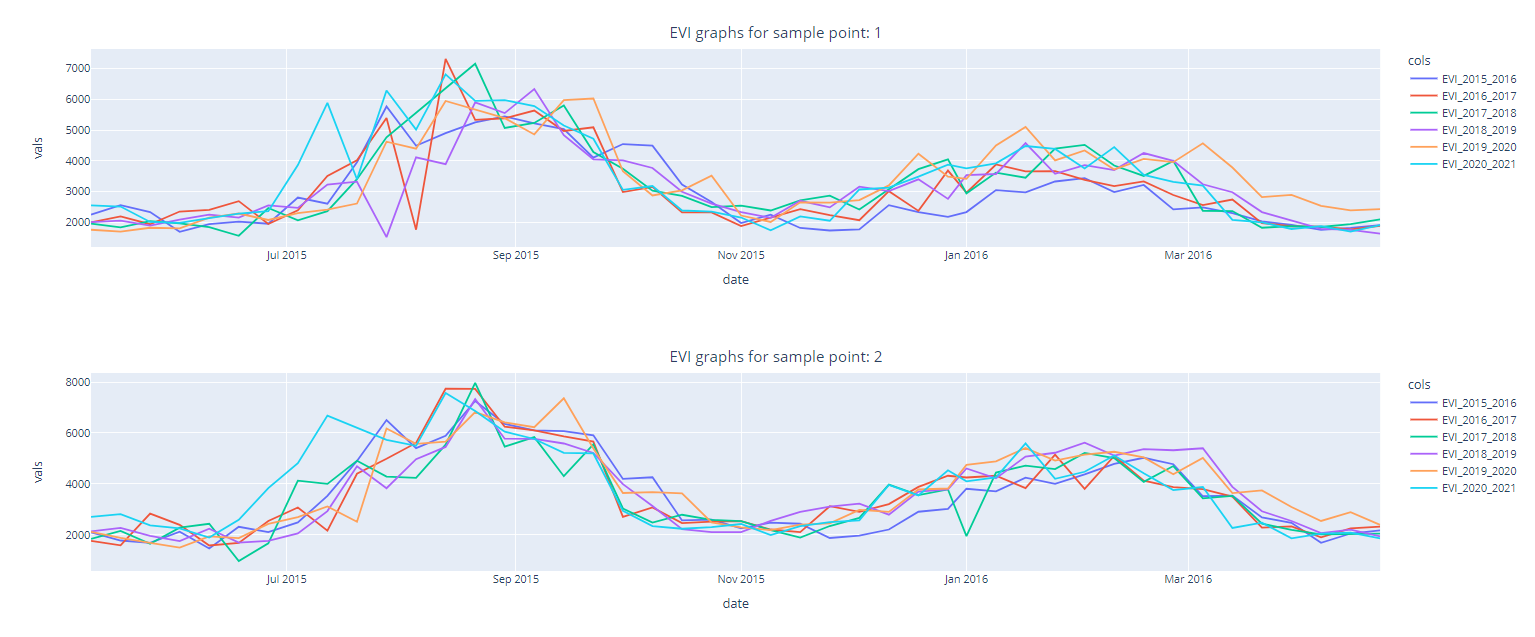
We will define general function for data of graph for each pointsdef smooth_df(df, window, order): # to be implemented later ''' apply a Savitzky-Golay filter over the dataframe and return list ''' pass def normal_df(): # to be implemented later pass def graphData(df_input, point_id, apply_filter): df_new = df_input[df_input['id']==point_id].sort_values(by=['date']) # data for each year df_15_16 = df_new[(df_new['date'] > '2015-05-01') & (df_new['date'] < '2016-04-30')] df_16_17 = df_new[(df_new['date'] > '2016-05-01') & (df_new['date'] < '2017-04-30')] df_17_18 = df_new[(df_new['date'] > '2017-05-01') & (df_new['date'] < '2018-04-30')] df_18_19 = df_new[(df_new['date'] > '2018-05-01') & (df_new['date'] < '2019-04-30')] df_19_20 = df_new[(df_new['date'] > '2019-05-01') & (df_new['date'] < '2020-04-30')] df_20_21 = df_new[(df_new['date'] > '2020-05-01') & (df_new['date'] < '2021-04-30')] if not apply_filter: df_sb = df_15_16[['date']] df_sb['EVI_2015_2016'] = df_15_16['EVI'].tolist() df_sb['EVI_2016_2017'] = df_16_17['EVI'].tolist() df_sb['EVI_2017_2018'] = df_17_18['EVI'].tolist() df_sb['EVI_2018_2019'] = df_18_19['EVI'].tolist() df_sb['EVI_2019_2020'] = df_19_20['EVI'].tolist() df_sb['EVI_2020_2021'] = df_20_21['EVI'].tolist() else: df_sb = df_15_16[['date']] df_sb['EVI_2015_2016'] = savgol_filter(df_15_16['EVI'].tolist(), 9, 2) df_sb['EVI_2016_2017'] = savgol_filter(df_16_17['EVI'].tolist(), 9, 2) df_sb['EVI_2017_2018'] = savgol_filter(df_17_18['EVI'].tolist(), 9, 2) df_sb['EVI_2018_2019'] = savgol_filter(df_18_19['EVI'].tolist(), 9, 2) df_sb['EVI_2019_2020'] = savgol_filter(df_19_20['EVI'].tolist(), 9, 2) df_sb['EVI_2020_2021'] = savgol_filter(df_20_21['EVI'].tolist(), 9, 2) # convert to long (tidy) form dfm = df_sb.melt('date', var_name='cols', value_name='vals') return dfm - Lets first observe Time series EVI chart without Savitzky-Golay filter
I have shown the few sample only. You can modify as per your requirements.for index, row in gdf.iterrows(): # print('EVI graphs for sample point: ', row['point_id']) if index < 2: title_plot = 'EVI graphs for sample point: {}'.format(row['point_id']) point_id = row['point_id'] dfm = graphData(df, point_id, False) fig = px.line(dfm, x="date", y="vals", color='cols') fig.update_layout( title={ 'text': title_plot, 'y':0.9, 'x':0.5, 'xanchor': 'center', 'yanchor': 'top'}) fig.show()
- Lets now observe Time series EVI chart with Savitzky-Golay filter
I have shown for all available samples. You can modify as per your requirements.for index, row in gdf.iterrows(): # print('EVI graphs for sample point: ', row['point_id']) title_plot = 'EVI graphs for sample point: {}'.format(row['point_id']) point_id = row['point_id'] dfm = graphData(df, point_id, True) fig = px.line(dfm, x="date", y="vals", color='cols') fig.update_layout( title={ 'text': title_plot, 'y':0.9, 'x':0.5, 'xanchor': 'center', 'yanchor': 'top'}) fig.show()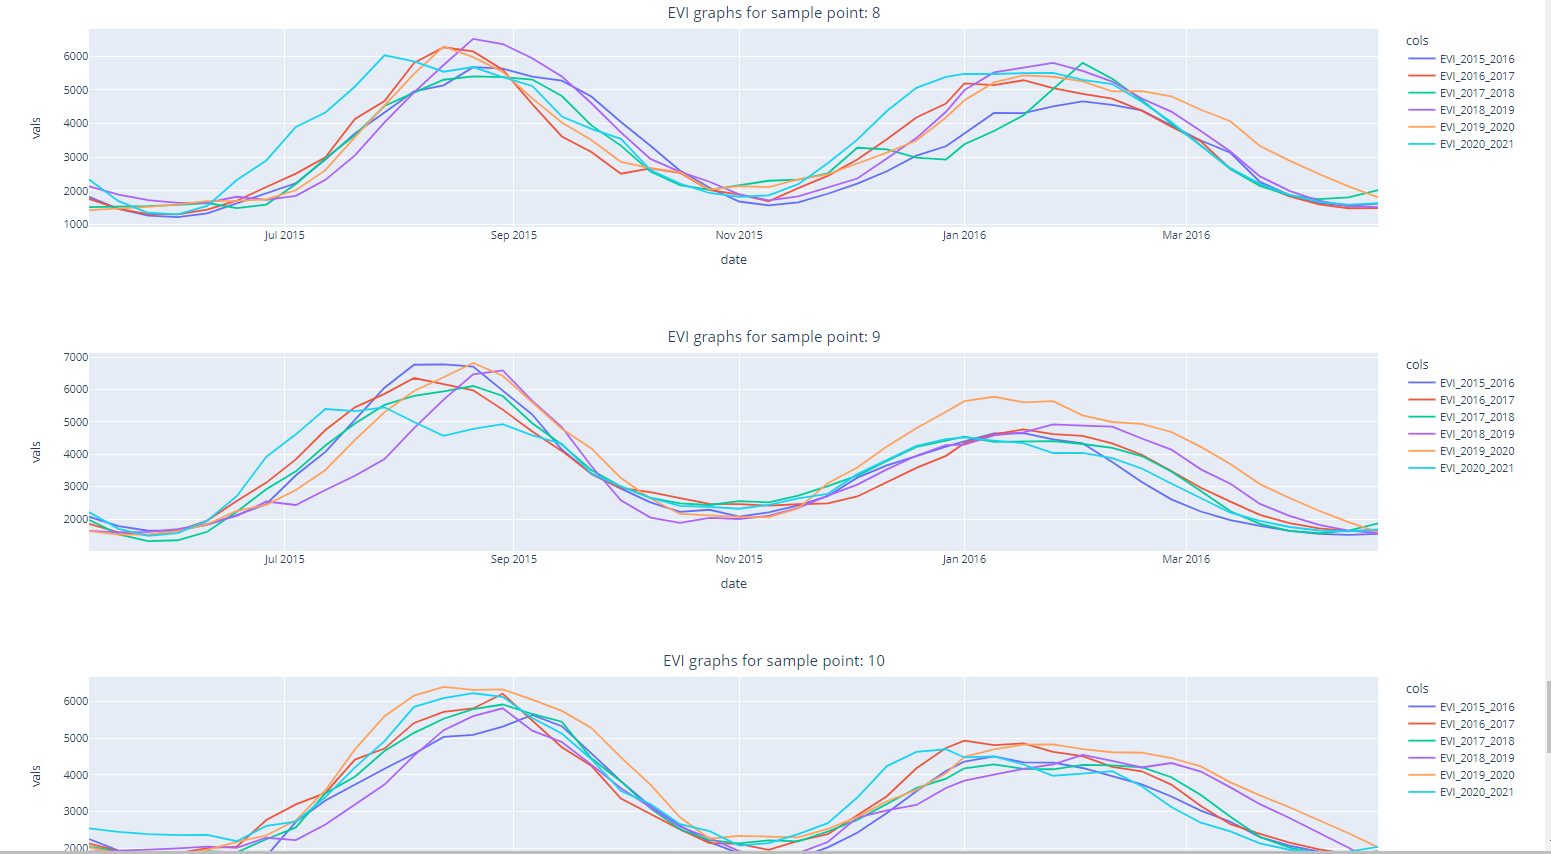
Source code: github_link
Please let us know your thoughts on this with following comment section we will definetly reach out to you on your query and feedback.
0 Comments