
Enhanced Vegetation Index (EVI) from Sentinel-2 image on Google Earth Engine
 from Sentinel-2 image on Google Earth Engine")
What is Enhanced Vegetation Index (EVI)?
The enhanced vegetation index (EVI) is an 'optimal' vegetation index that decouples the canopy background signal and reduces atmospheric impacts to improve the vegetation signal with greater sensitivity in high biomass regions and improved vegetation monitoring.
The Enhanced Vegetation Index (EVI) from Landsat, Sentinel-2 image is comparable to the Normalized Difference Vegetation Index (NDVI), and it quantifies the vegetation greenness. While the EVI is calculated in the same way as the NDVI, it accounts for some distortion in reflected light caused by airborne particles and the ground cover beneath the vegetation. When examining rainforests and other areas of the Earth with high levels of chlorophyll, the EVI data product does not get saturated as quickly as the NDVI.
EVI Versus NDVI, in terms of advantage:
- EVI is more sensitive to changes in areas with high biomass (a major flaw in NDVI),
- limit the impact of atmospheric conditions on vegetation index values,
- adjustment for canopy background signals/noise
EVI is more sensitive to changes in the plant canopy, such as leaf area index (LAI), canopy structure, plant phenology, and stress, than NDVI, which primarily responds to the amount of chlorophyll present.
Enhanced Vegetation Index (EVI) Formula:
EVI includes an "L" value for canopy background, "C" values for air resistance coefficients, and blue band (B) values. In most cases, these improvements allow for index calculation as a ratio of the R and NIR values while minimizing background noise, ambient noise, and saturation.
EVI = G * ((NIR - R) / (NIR + C1 * R – C2 * B + L))
The output range of EVI calculation typically varies from 0.0 to 1.0.
Enhanced Vegetation Index EVI value range = 0-1
Calculation of EVI for Sentinel 2 in Google Earth Engine (GEE):
Now we divide into python code for the compution of EVI from Google Earth Engine (GEE) on step by step basis. We will be using jupter notebook for this tutorial.
- Importing the modules
# Import earth engine python api and geemap import geemap, ee # Authenticate the earthengine with credentials ee.Initialize() - Choose area of interest for the study. In my case i have taken Boundary of Nepal.
# get our Nepal boundary # I have taken level 0 data for country data from FAO datasets aoi = ee.FeatureCollection("FAO/GAUL/2015/level0") .filter(ee.Filter.eq('ADM0_NAME','Nepal')).geometry() # adjust indentation here, May get error - Define function for EVI computation.
def getEVI(image): # Compute the EVI using an expression. EVI = image.expression( '2.5 * ((NIR - RED) / (NIR + 6 * RED - 7.5 * BLUE + 1))', { 'NIR': image.select('B8').divide(10000), 'RED': image.select('B4').divide(10000), 'BLUE': image.select('B2').divide(10000) }).rename("EVI") image = image.addBands(EVI) return(image) - Date of image, addtion in image collection as a properties.
def addDate(image): img_date = ee.Date(image.date()) img_date = ee.Number.parse(img_date.format('YYYYMMdd')) return image.addBands(ee.Image(img_date).rename('date').toInt()) - FIlter image and apply the computation function over image collection.
# filter sentinel 2 images and apply the EVI formula, finally we obtain # single image with median operation Sentinel_data = ee.ImageCollection('COPERNICUS/S2') \ .filterDate("2022-03-01","2022-03-31").filterBounds(aoi) \ .map(getNDVI).map(getEVI).map(addDate).median() - FInally visualize the EVI image obtained with Geemap, you can also export the image or use the image for further analysis.
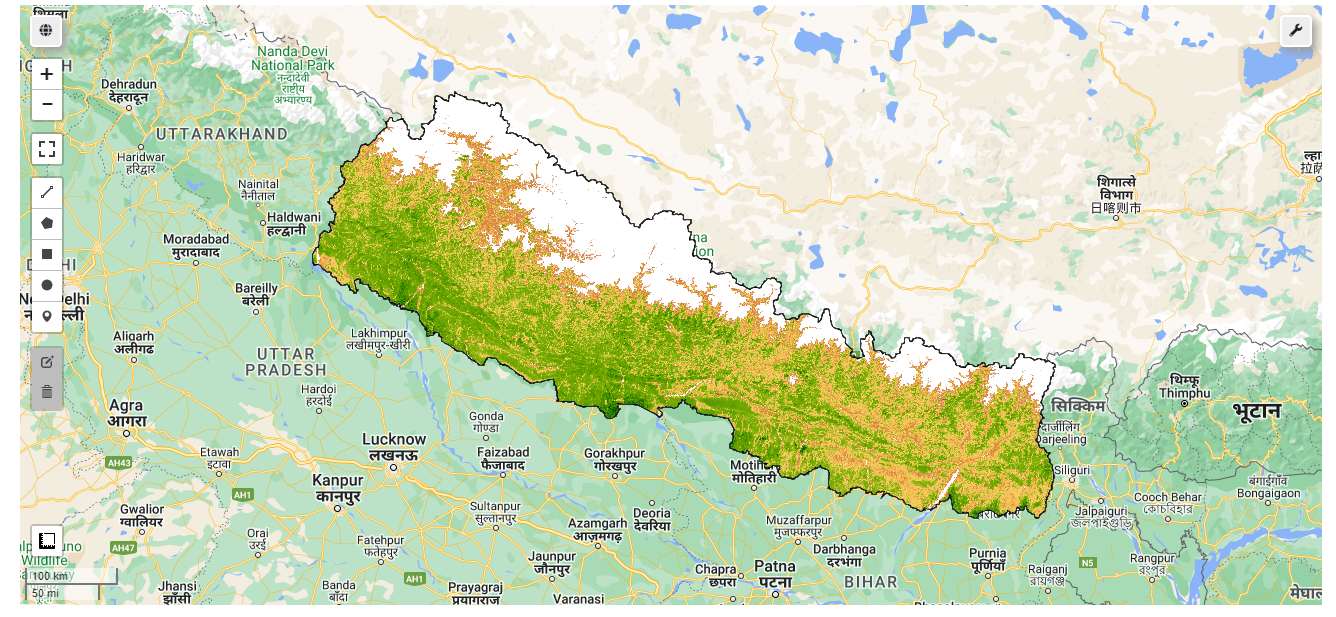
# set some thresholds
#  A nice EVI palette
palett = [
    'FFFFFF', 'CE7E45', 'DF923D', 'F1B555', 'FCD163', '99B718',
    '74A901', '66A000', '529400', '3E8601', '207401', '056201',
    '004C00', '023B01', '012E01', '011D01', '011301']

pall = {"min":0.1, "max":0.8, 'palette':palett}

# initialize our map
map1 = geemap.Map()

map1.centerObject(aoi, 8)
map1.addLayer(Sentinel_data.clip(aoi).select('EVI'), pall, "EVI")

map1.addLayerControl()
map1
Final Output obtained for this tutorial is as follow:
Source code: github_link
Please let us know your thoughts on this with following comment section we will definetly reach out to you on your query and feedback.
Bikesh | General comments
May 11, 2022, 4:55 p.m.
Nice work