Vector tiles with Django for developing GIS web applications
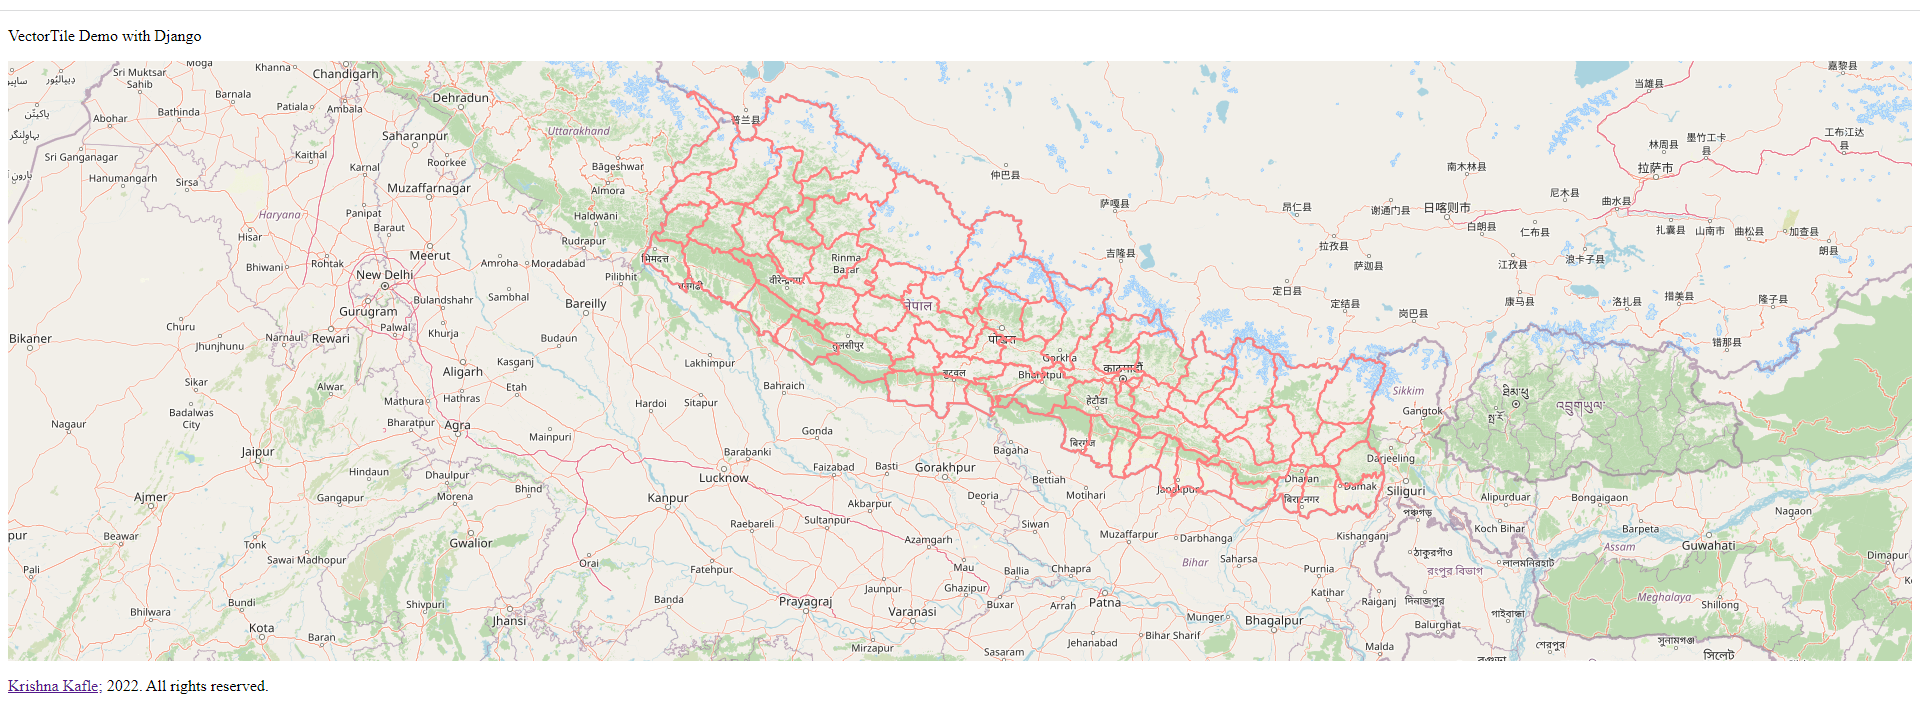
You are reading this article, so I assume you have faced problems loading vector layers in the web map. I will discuss visualizing the large shapefiles/geojson on web maps. So let's first dive into the concept of web mapping. Anyone working on webGIS will find this post beneficial. OGC Standards (Ref) OGC standards are developed by members to make location information and services FAIR – Findable, Accessible, Interoperable and Reusable. They are used by software developers to build open interfaces and encodings into their products and services. Standards are the main "products" of OGC and have been developed by the membership to address specific interoperability challenges, such as publishing map content on the Web, exchanging critical location data during …
Read More →
Minimum, Mean and Maximum NDVI values for Polygon samples on Google Earth Engine (Python API)

Every time I saw the curve as shown above in research papers and blogs, I wondered how it was prepared and what it meant. I used to think the sample curve like this was prepared based upon the point feature. I never thought this could be made based on the polygon samples. Normalized Difference Vegetation Index (NDVI): The Normalized Difference Vegetation Index (NDVI) measures the difference between near-infrared (which vegetation strongly reflects) and red light (which vegetation absorbs) to quantify vegetation. NDVI always ranges from -1 to +1. I am now interested to analyze the time series NDVI statistics (Min, Mean & Max) with polygon samples. NDVI statistics(Min, Max & Mean): Let's take the case; We have multiple crop samples …
Read More →
Extraction of raster values from point samples on Google Earth Engine (GEE)
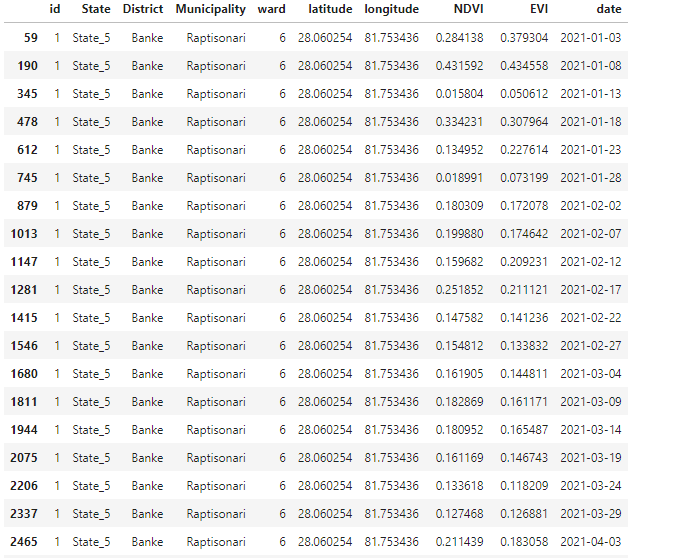
Background: In this tutorial, We plan to extract the raster cell values from the set of point features nd records the values in the attribute table as an output. on Google Earth Engine (GEE) with python API. Before we dive into the working steps, I will explain the general idea of how this concept can be implemented. The process of raster value extraction can be implemented in two ways, Directly extracting the raster values by overlaying raster with point data. Raster value which perfectly overlays with the point is taken. Buffer (circle, square) around the point is created, and raster statistics (mean) are obtained. This mean is taken as the raster value for points. Refer this: Scenario, where you are going …
Read More →
Retrieving Leaf Area Index (LAI) on Sentinel 2 image with Google Earth Engine (GEE)
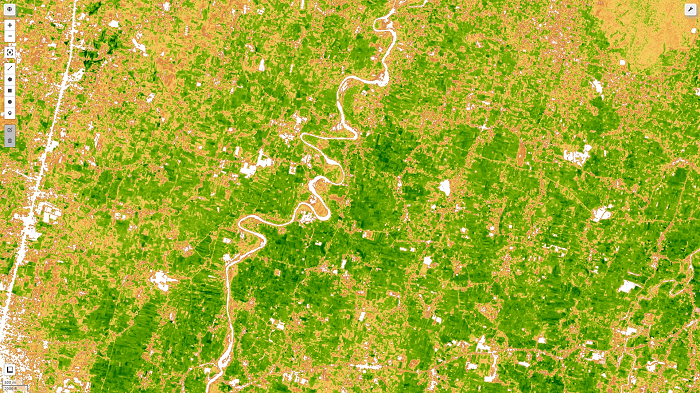
What is Leaf area index (LAI)? The leaf area index (LAI), equal to half of the total green leaf area per unit of the horizontal ground surface, is a crucial structural feature of vegetation. Canopy interception, evapotranspiration, and gross photosynthesis are directly related to LAI since leaf surfaces constitute the primary frontier of energy and mass exchange. I have explained this on my previous post, but I thought it needs to be covered in sperate post along with step by step guide for computation of LAI. I have uploaded the notebook for it's implementation at the end of this article. Leaf Area Index (LAI) Formula: This index is used to forecast crop growth and yield and estimate foliage cover. ENVI calculates …
Read More →
Calculating different Vegetation Indices in Google Earth Engine (Sentinel -2 images)
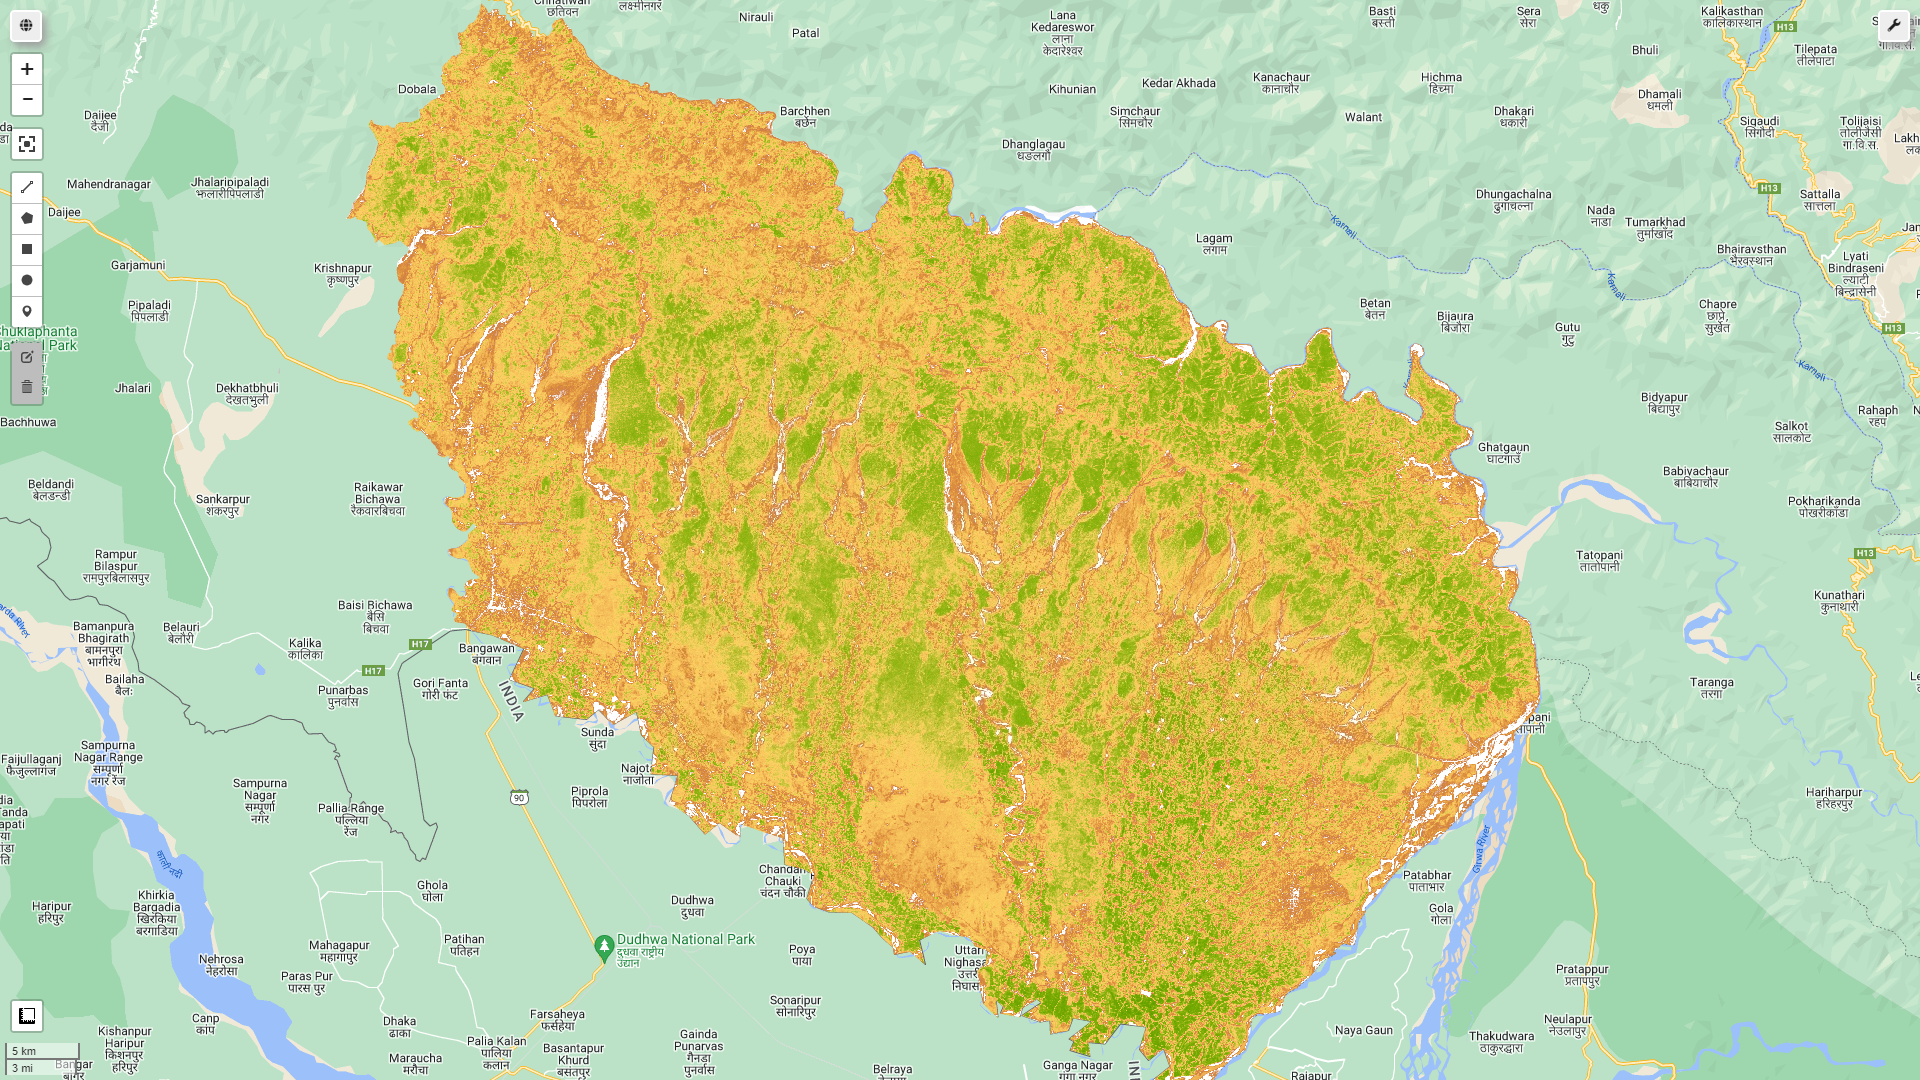
In previous post, I have published the article for EVI and NDVI calculation from sentinel 2 image on Google earth engine (GEE) platform. In this article, I will be showing how various vegetation indices can be computed on GEE platforms and can be added to image collection. So, let's dive into various vegatation indices directly. Greenness (Green Leaf Index) The Green Leaf Index, also known as the Greenness Index, shows how the reflectance in the green channel compares to the other two visible wavelengths (red and blue). The formula for calculation of GLI is: GLI = (2*GRN-RED-BLU)/(RED+GRN+BLU) GRN pixel values from the GREEN band RED pixel values from the RED band BLU pixel values from the BLUE band The lower the greenness index, the higher …
Read More →
Calculating NDVI from Sentinel-2 Images
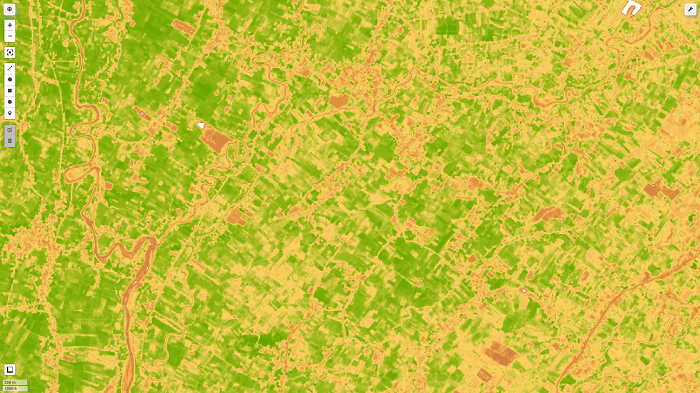
Let's start with the introduction: What is NDVI (Normalized Difference Vegetation Index)? The Normalized Difference Vegetation Index (NDVI) measures the difference between near-infrared (which vegetation strongly reflects) and red light (which vegetation absorbs) to quantify vegetation. NDVI always ranges from -1 to +1. If there are no green leaves, the value is zero. A zero denotes no vegetation, whereas a value close to +1 (0.8-0.9) suggests the highest density of green leaves conceivable. However, the land cover type does not have its specific limit of NDVI values. Normalized Difference Vegetation Index (NDVI) Formula: The formula for calculating NDVI is as follows: NDVI = (NIR — RED)/(NIR + RED) NIR – reflection in the near-infrared spectrum RED – reflection in the …
Read More →
Enhanced Vegetation Index (EVI) from Sentinel-2 image on Google Earth Engine
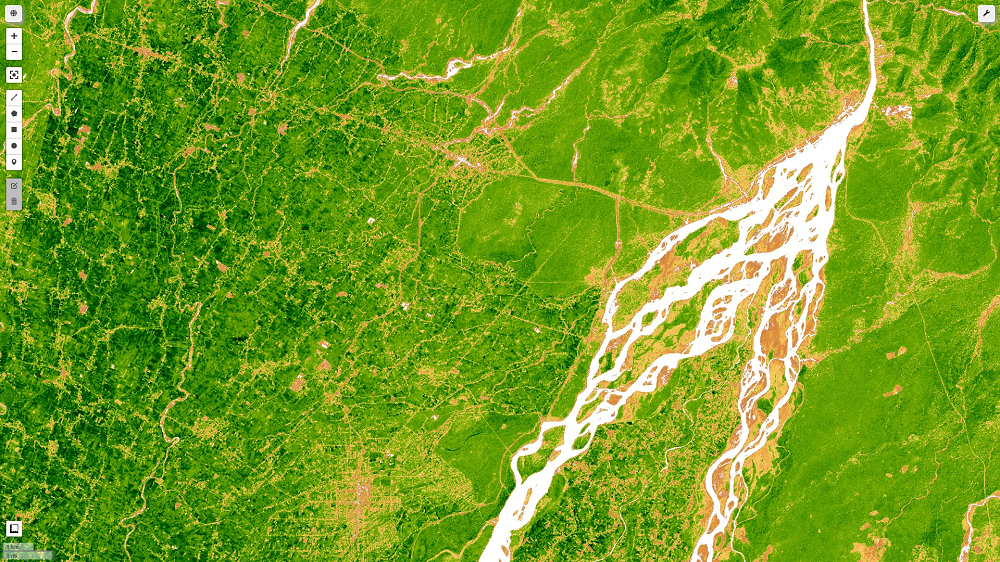
What is Enhanced Vegetation Index (EVI)? The enhanced vegetation index (EVI) is an 'optimal' vegetation index that decouples the canopy background signal and reduces atmospheric impacts to improve the vegetation signal with greater sensitivity in high biomass regions and improved vegetation monitoring. The Enhanced Vegetation Index (EVI) from Landsat, Sentinel-2 image is comparable to the Normalized Difference Vegetation Index (NDVI), and it quantifies the vegetation greenness. While the EVI is calculated in the same way as the NDVI, it accounts for some distortion in reflected light caused by airborne particles and the ground cover beneath the vegetation. When examining rainforests and other areas of the Earth with high levels of chlorophyll, the EVI data product does not get saturated as …
Read More →


