Vector tiles with Django for developing GIS web applications

You are reading this article, so I assume you have faced problems loading vector layers in the web map. I will discuss visualizing the large shapefiles/geojson on web maps. So let's first dive into the concept of web mapping. Anyone working on webGIS will find this post beneficial.
OGC Standards (Ref)
OGC standards are developed by members to make location information and services FAIR – Findable, Accessible, Interoperable and Reusable. They are used by software developers to build open interfaces and encodings into their products and services. Standards are the main "products" of OGC and have been developed by the membership to address specific interoperability challenges, such as publishing map content on the Web, exchanging critical location data during disaster response & recovery, and enabling the fusion of information from diverse Internet of Things (IoT) devices.
We are interested in two main components:
- WMS (ref)
WMS is probably the best known of these three standards due to its widespread use by map servers to deliver map images. These images are typically in the form of raster tiles (PNG, GIF, or JPG).
- WFS (ref)
The WFS web service allows features to be queried, updated, created, or deleted by the client.
Vector Tiles:
Vector tiles, which were introduced recently, deliver data divided into nearly squared tiles. Though instead of using raster images, pre-generated vector data are presented for the requested map region. Map elements that overflow current tile are cut with a specific offset, which is essential when connecting tiles together.
Vector tiles are rendered on the client side of GIS applications. Each tile's component's appearance is governed by a map style. The style of the layer specifies color, font to be used for a label, the language of a label to be presented, and map element to be displayed. It provides more chances for quick map changes with on-the-fly requests.
Benefits:
a. Dynamic styling.
b. Size and speed.
c. Smooth interactions.
d. Dynamically querying
Now, Let's dive into the implementation of vector tiles in Django. I believe you are facing issues on webGIS projects where you need vector layers but can't visualize layers due to the large size of the shapefile or geojson. You may have seen a slow rendering time of a large geojson layer. Or you may have generalized the layer and tried to visualize the layer and found inconsistency between layers. You don't have to face similar issues anymore.
Let's first establish a database connection with Postgres (PostGIS enabled) on Django.
DATABASES = {
    'default': {
        'ENGINE': 'django.contrib.gis.db.backends.postgis',
        'NAME': 'vector-tiles',
        'USER': 'postgres',
        'PASSWORD': 'krishna',
        'HOST': 'localhost',
        'PORT': '5432',
    }
}
Import the vector layer to your database with PostGIS and inspect the database for your specific layer. In my case, I have loaded the district shapefile for Nepal. Use the following command for inspecting the database table.
python manage.py inspectdb district > db.txt
In my case, I have a model schema as follows:
from django.contrib.gis.db import models

class District(models.Model):

    gid = models.AutoField(primary_key=True)

    district = models.CharField(max_length=50, blank=True, null=True)

    first_stat = models.IntegerField(blank=True, null=True)

    geom = models.GeometryField(srid=4326)


    class Meta:

        managed = False

        db_table = 'district'
To serve the vector tiles for your client side, you have to define the API end-point on your Django app. Simultaneously, Url for an end-point is also defined.
# For django views

from django.views.generic import ListView

from vectortiles.postgis.views import MVTView

from vectortileApp.models import District # my module


class DistrictTileView(MVTView, ListView):

    model = District

    vector_tile_layer_name = "districts" # name for data layer in vector tile

    vector_tile_fields = ('district',) # model fields or queryset annotates to include in tile

    vector_tile_geom_name = "geom" # geom field to consider in qs
# for django urls:
# for django urls:

path('layers/district/<int:z>/<int:x>/<int:y>', views.DistrictTileView.as_view(), name="district-layer"),
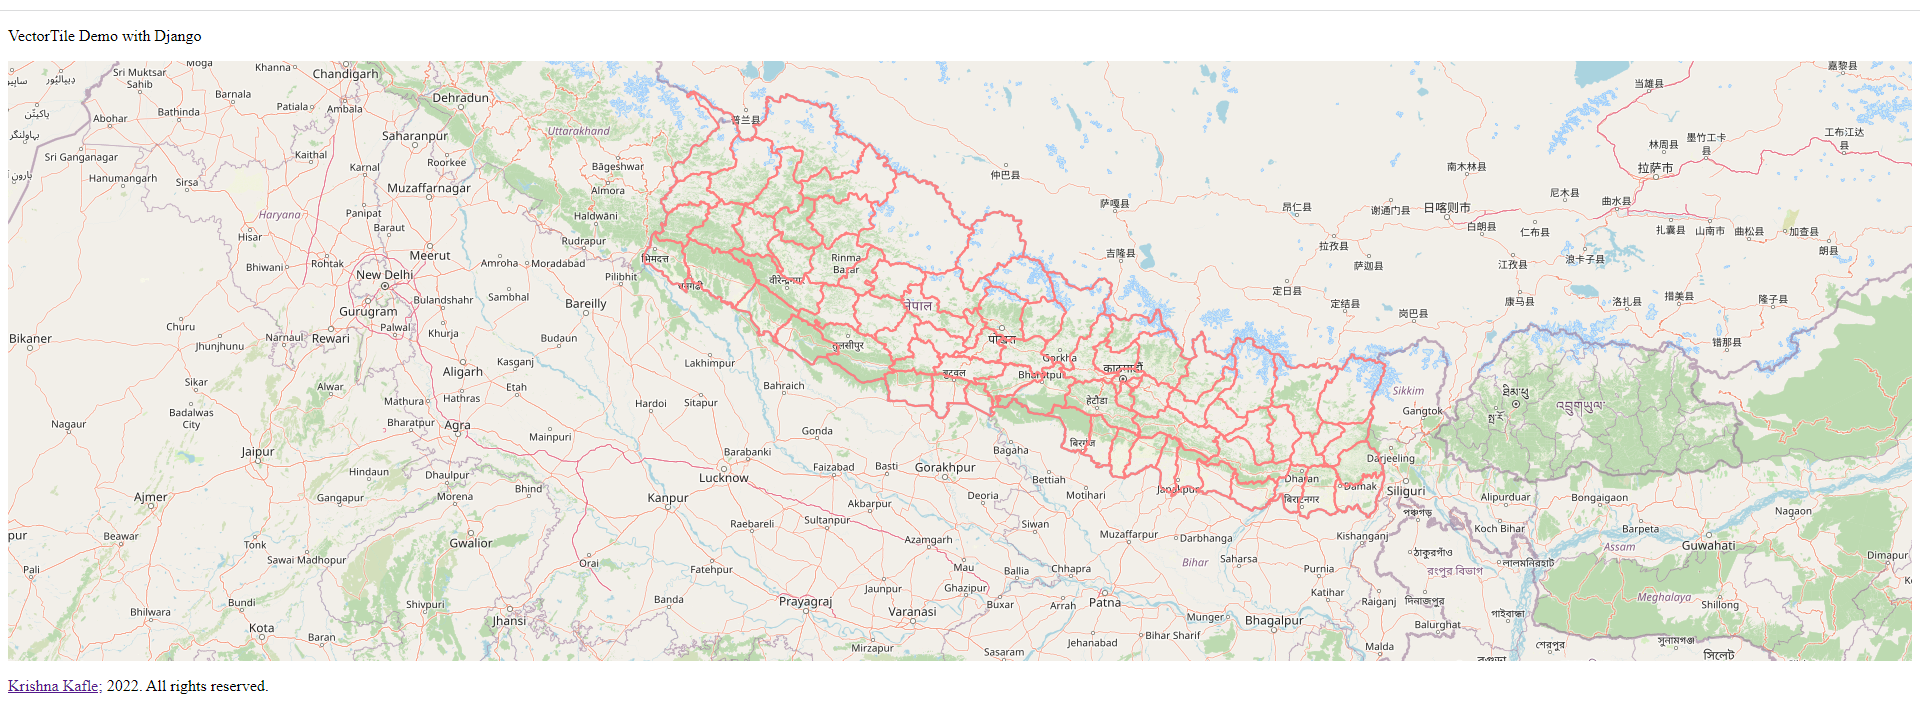
Now we have established the backend end-points for serving the vector tiles. We will move on to the client side utilizing these vector tiles on the client side library, namely Openlayers and leaflet.
For Openlayers, define layers as:
var districtLayer = new ol.layer.VectorTile({

    id: 'district',

    title: 'District',

    visible: true,

    declutter: true,

    source: new ol.source.VectorTile({

        tileGrid: ol.tilegrid.createXYZ({

            maxZoom: 24

        }),

        format: new ol.format.MVT(),

        url: '/layers/district/{z}/{x}/{y}'

    }),
    style: new ol.style.Style({

        stroke: new ol.style.Stroke({

            width: 2,

            color: '#FF7F7F'
        })
    })
});

var spatialView = new ol.View({

      // projection: projection,

      projection: 'EPSG:3857',

      center: ol.proj.transform([83.5295724, 27.8866973518], 'EPSG:4326', 'EPSG:3857'),

      zoom: 7

  });

var frontmap = new ol.Map({

      layers: layers,

      target: 'map',

      controls: ol.control.defaults({

          zoom: false,

          attribution: false,

          rotate: false

      }),

      view: spatialView

  });

});
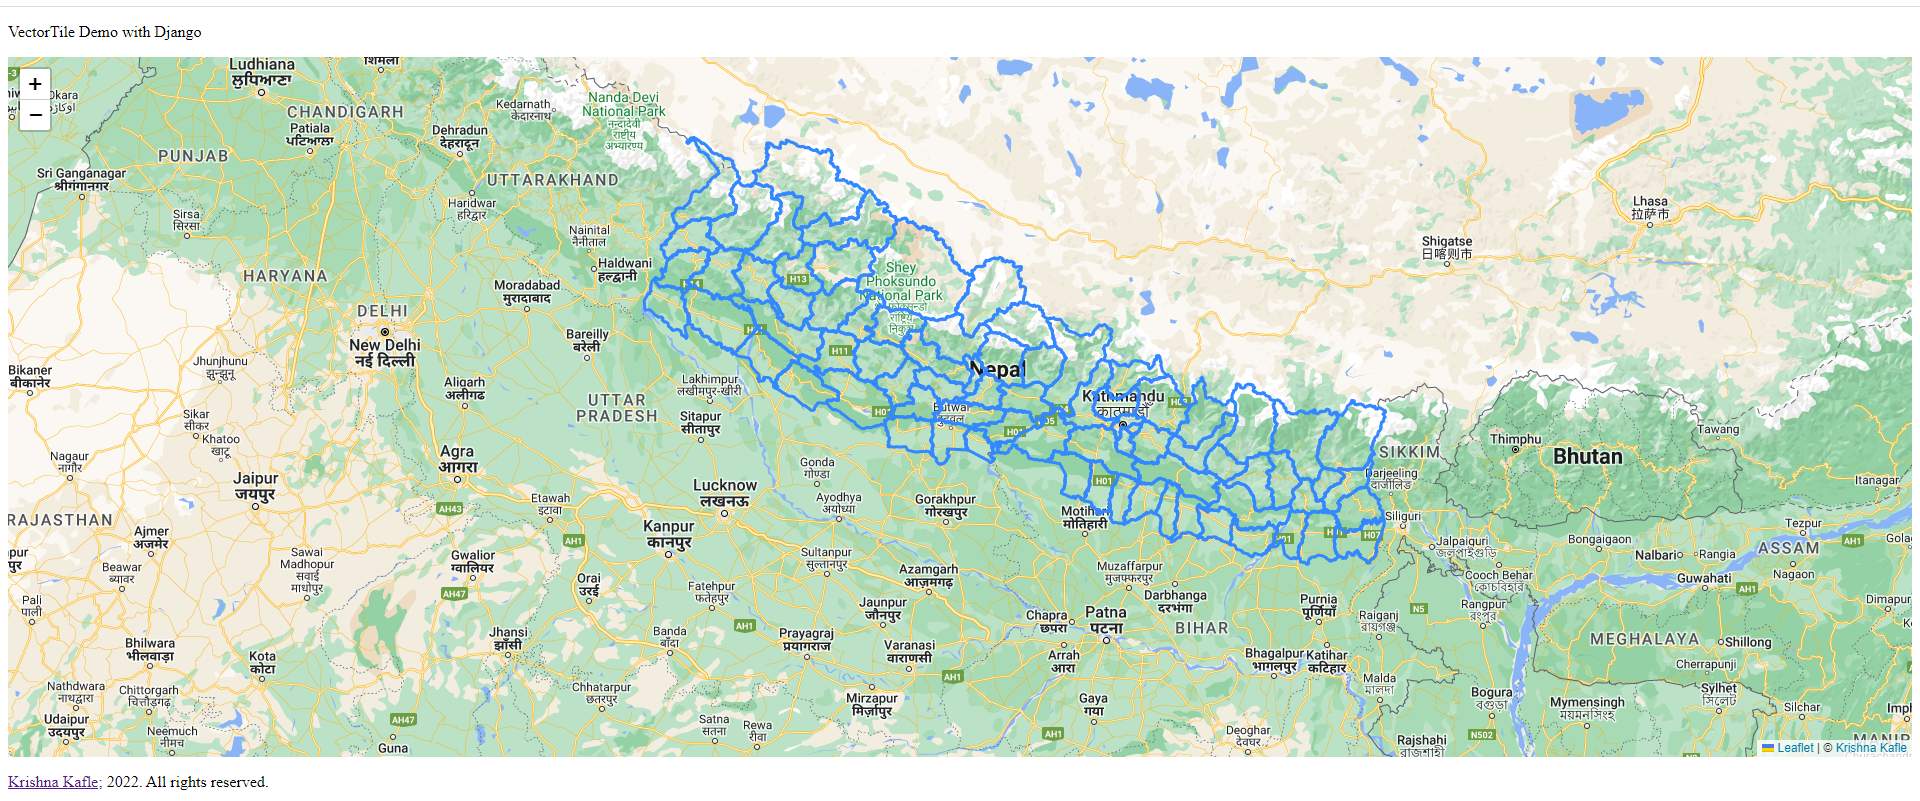
For Leaflet:
var map = L.map('map').setView([27.8866973518, 83.5295724], 7);
// L.tileLayer('https://tile.openstreetmap.org/{z}/{x}/{y}.png', {
// maxZoom: 19,
// attribution: '© OpenStreetMap'
// }).addTo(map);
L.tileLayer('http://{s}.google.com/vt/lyrs=m&x={x}&y={y}&z={z}',{
maxZoom: 20,
subdomains:['mt0','mt1','mt2','mt3']
}).addTo(map);
var vectorTileUrl = "/layers/district/{z}/{x}/{y}";
var mapboxVectorTileOptions = {
rendererFactory: L.canvas.tile,
attribution: '© <a href="https://kaflekrishna.com.np/">Krishna Kafle</a>',
// vectorTileLayerStyles: vectorTileStyling,
};
var mapboxPbfLayer = L.vectorGrid.protobuf(vectorTileUrl, mapboxVectorTileOptions).addTo(map);
Output:

Source code: github_link
Please let us know your thoughts on this with following comment section we will definetly reach out to you on your query and feedback.

abin | General comments
Nov. 21, 2022, 9:43 a.m.
Thank you krishna for this tutorial. This work for me.